Some blog posts give us a glimpse of our own obituary. When a Seattle journalist last week speculated on what went wrong at a startup, an anonymous mob formed to attack the CEO, comment by comment. It was hard not to feel like you were watching your own beheading.
No one objected. And almost everyone in Seattle read the post. As a French courtier observed, “the people we call our friends are merely the ones we know would not themselves murder us, but would let the murderers have their way.”
The CEO in question was undoubtedly a hard-charging Maniac. But that’s not always bad. I tend to divide leaders into two types: The Maniac and The Professional. The Maniac is emotional, demanding, unreasonable. His great gift is high standards. He gets away with it only by being brilliant and charming.
I once interviewed someone managed by the most brilliant, charming business leader in the world: Steve Jobs. The experience was, the interviewee explained in a thick French accent, “the most harrowing of my life.”
Maybe it’s impossible to accomplish anything insanely great without a Maniac — anyone running a start-up team has to have, at the least, the glands of a Maniac. But anyone with a heart spends nights regretting it.
Whether we acknowledge it or not, plenty of leaders try to be like Steve Jobs and no one else can be. A lot of startups blow up because of the Steve Jobs syndrome.
Lately, I’ve found a second role model: the manager at the Capitol Hill QFC. Unassuming, a little pink in the skin, slightly rotund, the guy who runs my neighborhood grocery store is the portrait of The Professional. He’s a far cry from Steve Jobs, but his admirable qualities at least seem repeatable. I’ve studied them carefully:
He’s accessible. On any busy weekend, he’s standing at the head of the registers, ready to direct a customer to a can of beans. He carries a clipboard, which he tucks under his arm as soon as you approach (what does he have written down there?)
He shops in his own store, loading up in the frozen food aisle late at night, joking around with the graveyard employees stocking the shelves. Straining to hear their conversation, I once saw one of them — probably earning less than $10 an hour — give him a hug.
He’s a part of the team. He wears the QFC outfit with pride, his grocer’s tie nicely knotted. Though he’s not very tall, his posture is so straight he almost seems to be leaning back, as if better to survey a Thackeravian bustle of commerce. He doesn’t stand apart from his team, except by how he carries himself.
He smiles a lot, almost as a form of breathing. Since I believe that a company’s brand, like a painting or a poem, is essentially just an emotion sustained across time and between people — his smile is important to me; at some level, one of the emotions expressed by a brand has to be a form of joy. It starts at the top, and it can’t be faked.
He works hard. Late at night and on weekends, he’s always there.
I know it’s uncool to have a grocer as a role model alongside a tech god, but a lot of high-tech managers, myself included, could learn a lot from Mr. QFC.
Redfin published an essay in TechCrunch today, “To Steve or Not to Steve,” about entrepreneurs who impose their personalities on a startup.
Redfin’s Matt Goyer read it first, to make sure it wouldn’t offend anyone. Matt’s an insightful soul, so I knew he would also appreciate the nuances of my argument.
When he was done, he looked up and said, “So you’re saying I should be a ***hole.”
“No,” I said, “I’m saying you should be a sensitive ***hole…” We stared at each other. “Or maybe not an ***hole at all.”
It’s a tough balance. As the CEO of InterContinental Hotels Group said of himself in a recent New York Times profile: “I’m very sensitive to how people are thinking and feeling at any given moment.”
But he also described himself as a super-action hero, boldly acting on his own in ways that surprised everyone. And this is what’s nearly impossible: to know how a decision will make everyone feel, then to make that decision anyway. It’s why many great technology entrepreneurs have mild forms of Asperger’s syndrome: it frees them to act, to decide, to drive people without much emotional friction.
If you don’t start that way, maybe that’s how you end up. Last week, I saw the “September Issue,” a documentary about Anna Wintour, the head of Vogue Magazine, and her efforts to publish its phone-book-sized September 2007 issue. It was moving to see so many flamboyant, talented people work so hard to make something irrevocable, definitive and perfect; many are undoubtedly now unemployed.
The entire movie consists of Anna walking into one room after another, picking one skirt or photo out of 50, and leaving the creators of the other 49 absolutely annihilated. Time and again, she is asked how she feels. She mostly answers with the warmth of a bare steel table.
For some, it is necessary to be this way. The historian Edmund Morris described a day he spent with President Reagan, starting just outside the elevator with an unscripted photo opportunity alongside a police officer, blinded in the line of duty. This meeting and the ones that followed put Morris through the wringer; the sensitive writer was exhausted by lunch.
But Reagan, famous for momentarily failing to recognize his own son in a handshake line, deftly moved from one emotionally drenched encounter like this to another without apparently feeling a thing. Morris concluded that this detachment was the only way Reagan could make any decision affecting millions.
I don’t know if the choice is that stark for all of us. In the mostly dreadful Wim Wenders film, “Wings of Desire,” the angels can hear the thoughts of everyone in a train, on a street or in a cafe. The film is a near-unbearable cacophony of mortal thoughts that gradually becomes a comforting hum. When one angel forsakes his heavenly powers, he enters a cone of silence, unable to know what anyone is thinking but now able to act in the world. He can’t believe how lonely it is.
This loneliness is all well and good if you’re Ronald Reagan, or Anna Wintour, or an angel, who knows just what to do. But for the rest of us, the cacophony is essential to making a decision.
We engage people because we have to in order to figure out the best course of action. This is what makes deciding in the end so painful: that we’ve identified with a point of view completely that we then have to reject. It is hard to be emotional and then unemotional. It is hard to lose yourself in your company’s mission without occasionally forgetting the feelings of the people on the mission with you.
But I have never given up on the idea that you can — and you have to — strike a balance between empathy and decision.
As part of our brown-bag lunch program on management best practices, the legendary Brian McAndrews visited Redfin Friday. Brian took aQuantive through the highs and lows, leading the company out of the dot-com bust and building it into the juggernaut that sold to Microsoft in 2007 for $6 billion. His talk on how to manage folks was another tour de force.
Brian has worked with and for all sorts of leaders in his career which, in addition to his time at aQuantive, has included stints at General Mills, Capital Cities/ABC, Disney and Microsoft. His advice is based on the great bosses he’s worked for and the bad bosses, and from his own experience as a CEO. As he laid out seven best practices, we did our best to keep up with what he said. Below is not a transcript – no one at Redfin is a stenographer, and I don’t take much time to clean these notes up later — but some of the useful bits and pieces of what he said, in as close to his own voice as we could get:
Set clear objectives, hold people accountable and get out of the way: if I had to sum up my management philosophy, this would be it. You want objectives to be aggressive but achievable. Push decision-making down and out in the organization, essentially closer to the customer. At aQuantive, we tried to empower people in sales and support. That means you have to have the right incentives, the right objectives and parameters. But within that framework, the more you can push P&L responsibility out, the better. This will help you attract and retain the best people. Do you want to be the only leader in your company? No…
One of the fundamental responsibilities that a manager has is building a team. Who is on their team is their call. That’s the most important decision a manager makes. I interviewed candidates for managers who reported to me, but this was only to give input and of course to help in recruiting the candidate. I once met a candidate who one of my direct reports wanted to hire who didn’t really do it for me. He hired the candidate anyway, and about six months later he fired that person. We hurt ourselves over that six months, but the manager who hired him also hired five or six good people too. That not’s a terrible batting average. I used to tell my own board, “If you don’t like the team I’m hiring, then fire me.” I held that manager to the same standard.
Micromanagement does not scale. Founders can be micromanagers. Sometimes micromanagement comes from a vision, sometimes it comes from a manager just being insecure. Micromanagement results in the loss of talented executives. Do you want people working for you who just take direction? Or do you want people who are going to lead, who are going to push back? We all know of some visionary founder or “celebrity CEO” who may have a reputation for micromanagent and so we ask: what about him? Doesn’t he prove you wrong? My answer is “no.” First of all, if the company is truly successful, my bet is their micromanagement is seriously overrated. Or if not, they are an extreme exception — and they’ll be in deep trouble when that person leaves since the people below him or her have not been trained to lead themselves. To support the “exception” point, look at lists of the top companies: best-run companies, best-managed companies, best places to work. The vast majority of these companies – if not all of them – are not led by these “celebrity CEOs” with micromanagement tendencies. In fact, the best companies to work for are led by CEOs you couldn’t name.
The way to get job security isn’t to own every decision, but to hire smart people. The board may say, wow, this person is better than you are. That’s a risk I’m willing to take. I often tell people who work for me: “The more you tell me, the less I will bother you.” Tell me what’s going on in our one-on-ones and I’ll stay out of your hair.
Micromanagement is a virus: the time and energy wasted by people down in the organization modeling that behavior is huge. When I have to present to a micromanager, I’m expected to know everything just as he would, which is a waste of time. As CEO at aQuantive, I was once asked at a board meeting what I thought of an executive’s presentation, and I said you already heard what I think. That executive knew more about the topic than I did, and he represented my point of view. Maybe the Board wanted me to have some special insight, but my insight was hiring him.
It is far more important to be respected than liked: act with integrity, be honest and transparent, treat people with respect and dignity. Being direct and honest often can mean delivering difficult news, news that people don’t want to hear. Some people don’t get that. A senior HR person I worked with viewed his job as what might be called a union leader, to lobby for whatever the employees wanted. Yes, your job is to represent employee needs to management, but it’s also to represent management to the employees.
Some decisions employees won’t like. My standard was: “Could I be ok with a decision that showed up in the New York Times, could I defend it?” For example, a compensation decision: could I defend to this manager why I was paying his or her peer more than her based on their performance. Of course in a public company, the New York Times rule comes true, as many executives’ compensation is public.
That can create some interesting dynamics. At aQuantive we said we had no politics, and certainly we had very little politics. We could be direct and transparent, where people said what they felt in the meeting. In my view, for someone on my executive team, the worst thing you can do is not say anything in a meeting, then come in my office afterwards and tell me what you really thought. When people tried to do that, I’d say, “I don’t want to be a middle-man. Say what you think in the meeting.”
Give employees the right to be wrong: if we’re not making mistakes, we’re not taking enough risks. Just don’t make the same mistake twice. Make a mistake for the right reasons, for a client, for the business. Learn from your mistakes, and teach everyone. There are exceptions: mistakes of integrity are one-strike-and-you’re-out. Otherwise, mistakes can be good. One of my colleagues used to say: “The reason we’re better than other companies is because we’ve made more mistakes than they have.” Encourage a culture of admitting mistakes. No excuses, but explanations are fine. It’s great when a senior leader says in front of her boss that she made a mistake, it’s critical for others to see that, to see that it’s accepted, and not punished. It’s great to ask what might be considered “dumb” questions, and it’s great for other folks to see you ask dumb questions; you should model that behavior as an executive.
No jerks: no matter how smart someone is, if someone can’t get along with others, if somebody treats others badly, they’re out. Sometimes you worry that somebody is too smart to fire, too valuable to fire. That’s never true. The collateral damage that is being done to the morale and effectiveness of the people that “jerk” is interacting with is enormous, even if it is often hidden from his or her direct boss. When you do make the decision to fire someone who is a “jerk”, you often hear that the whole team will quit. That never happens either. Hire slowly, fire quickly. It’s right for the team, it’s right for the company, it’s right for the person leaving.
Have a bias for action: gather the data you reasonably can and make a decision. What people don’t realize is that sometimes doing nothing is a decision. You can get bogged down with consultants, meetings, PowerPoints. You want an organization where it’s always clear who is supposed to make a decision. This lets some people give input and others make the decision rather than having two people both posturing, because they’re vying to make a decision. And always align authority and responsibilty. You don’t want to be in a situation where you have no authority but you’re still accountable, where you can get blamed for something you didn’t do; or conversely, where someone who does make the decisions is not held accountable for them.
As CEO, I always felt the fewer decisions I was making, the better we were doing.
Live or die by your values: most companies have values but they often have too many. Who can remember 13 values? aQuantive only had four values, and everyone knew them. It was hard to pick just four; someone, for example, would say excellence has to be a value, I mean, don’t we want to be excellent? My job as CEO was to pick just four. What other decisions did I have to own? Well certainly picking the team was the most important. Acquisitions were a big part of our strategy. I had to make the final decision on compensation and budgets.
And that was it. What was interesting about Brian is that on the one hand he’s such an indelible figure – tall, with a deep voice uninflected by many doubts – and yet he stood in front of us for an hour trying to do the impossible, erasing himself bit by bit so you could see all the other great leaders at aQuantive more clearly. Many thanks to Brian for coming by, and to Madrona for hooking us up with him. We had a lot of people at Redfin buzzing about it, and already one meeting on Friday night giving someone authority over a problem he’d previously had to helplessly take the blame for — so it was definitely a big hit.
Any comments or questions for Brian, just post ‘em below and we’ll make sure he takes a peek.
The more complicated a business gets, the more of a math problem it becomes.
Running a lemonade stand, you don’t need to analyze gross margins or survey customers because you squeeze the lemonade yourself, and hand it to every customer. But once you have employees and customers you’ve barely met, numbers become more important.
For example, Redfin folks just finished reviewing a multi-million dollar business that wasn’t as profitable as it should be. We decided to get numeric on the problem, asking one of our number-crunchers to analyze tour costs and abandon rates in that market.
It isn’t actually an action. It’s a study, which will take weeks to complete, which may or may not result in a decision. Especially as a business grows, you need a bias for action.
It encourages learned helplessness: the person running that business isn’t the number-cruncher. So now you have two people screwing in a light-bulb instead of one, and less accountability.
There’s an alternative, often championed by one of the best consumer investors I’ve ever met, Marc Singer. Marc doesn’t look for math wizards to run a business. He looks for lemonade-standers, people who even in large organizations find a way to make every problem small.
Marc is always talking to me about somebody who ran a restaurant, a chain of movie theaters, a lawn-spraying service, a maker of gizmos that deafen the deer who wander onto your yard. Rather than analyzing all the data from an under-performing business, Marc often digs into the customer experience. Why is the food cold or the popcorn-line too long?
Marc has a word for this way of thinking. He calls it a “merchant sensibility.” In its classic sense, merchant sensibility is the ability for someone to guess which of two similar products a small store should stock. “You still measure whether the product the guy chose actually sells better,” Marc once explained to me, “But someone with merchant sensibility gets it right more often than other people.”
People aren’t born with this ability, and the ones who think they are just don’t recognize their own mistakes. People learn it, leaning back against the men’s magazines with eyes narrowed while customers walk into the store, watching carefully where customers pause and where they move on.
If Marc were in that review of our multi-million-dollar business, he might have recommended a similar approach: get in a car and go tour houses with customers, to find out first-hand what’s broken in the business.
At my last startup, Plumtree, we had number-crunchers and lemonade-standers. At one extreme there was a guy known as Master Blaster, who hired a number-cruncher to sit on his shoulder all the time and tell him what to do. And at the other was my friend Ken Lowe, who ran our East Coast business.
Like almost everyone from New Jersey, Ken was a lot smarter than he pretended to be; he founded his college’s Chaucer club because each new club got a stipend for beer. A large man, Ken often greeted me by asking “How much you benching these days?” In a meeting where a dozen bigshots reeled off their titles, Ken would wrap up the intros by saying, “Ken Lowe, Emperor of Japan.” A colleague once penetrated the inner sanctum of his home-office and reported back that it consisted of an absolutely bare desk, and a shrine of Yankees’ insufferabilia.
When the time came for Ken to present to the executive team, I didn’t think he’d do well. For seven years at Plumtree, I sat petrified in these meetings as our CEO, John Kunze, tried to figure out if the presenter really knew her stuff.
People started over-preparing, learning a script or memorizing formulae to describe a business that they lived and breathed 12 hours a day, six days a week. This prompted John to ask, “OK, but what’s really going on in your business?”
This was exactly the question that Ken Lowe hit out of the park, because he spent most of his time meeting customers and prospects, saying little, listening a lot. He could tell you when a deal that hadn’t closed was going to close, and when a customer who’d bought our software was going to fail. He probably had lots of numbers but the only one he talked about was his “blood number,” a bottom-line the business would hit or else, as Ken would say, “there will be blood… MINE. HA HA HA!”
Now as Ken realized, you need data and first-hand experience. Without a broad data set, you can lurch from problem to problem, and anecdote to anecdote, based on whatever you just saw in the field, so that every week a new problem is the most important problem in the world to solve.
But as a business grows, you tend to get more number-crunchers and fewer lemonade-standers; in looking at the numbers you can forget the lemonade even exists. You need to work the spreadsheets and squeeze the lemons too.
What a coup for Redfin! The founder and former CEO of CarMax, Austin Ligon, joined Redfin’s board of directors this week, and also made a small investment in the company. The note we sent out Monday night to everyone here at Redfin captures some of our excitement at Austin’s arrival:
The big news this week is that Austin Ligon, founder and former CEO of CarMax, is joining our board of directors! The board’s role is to ensure the management team makes money for shareholders over the short term and long term. The board meets quarterly to see whether we’re making money, and to go over any big initiatives we have planned.
A board usually consists of major shareholders and one or two folks known as outsiders, who have extensive operating experience but a very small stake in the company. Until now, the board has consisted of venture capitalists from firms like Madrona, Vulcan, DFJ and Greylock. I’m also on the board.
Austin is an ideal outside board member. CarMax, which opened its first store this week in 1993, is in many ways the Redfin of used cars, building trust with consumers by being honest and open with information in an industry that people haven’t always trusted. Like Redfin, CarMax is complicated, with huge analytical and online components, and operations spanning many locations.
Austin helped build CarMax into a company with $7.5 billion in 2006 sales, and retired a few years ago. He’s participating in Tuesday’s all-day board meeting. The board will join the Seattle employees for lunch, so if you have any questions, grab a chair next to Austin and fire away.
What does this mean for Redfin? Well, it’s a big vote of confidence in our business that someone of Austin’s caliber wants to get involved. Beyond that, Austin should help us figure out some tricky issues around managing a field organization, building a consumer brand and scaling a business. And he is a firm advocate of taking a long-term view and building a customer-driven business, both consistent with our values.
The morning after we sent this note, we had our first board meeting with Austin; his insights were even better than we expected. Over the course of the day, it became clear just how relevant Austin’s experience is to Redfin — it was almost as if he were genetically engineered to be able to help us — and how much inspiration we can take from CarMax’s success. Here are some of the similarities between Redfin and CarMax that Redfin’s management team was talking about long after the meeting was over:
CarMax focused first on building consumer trust, in an industry where consumers were skeptical, and no brand was well-trusted.
CarMax pays its field organization to do the right thing, not just sell cars at any cost.
CarMax is unapologetic about offering low, no-haggle pricing. The industry in which it operates has been unapologetic about trying to maximize per-transaction profit, and hostile to the ideas of value or efficiency.
CarMax believes that only way you can disrupt an industry is by being better and cheaper, not just one or the other.
CarMax grew slowly, market by market, perfecting the customer experience before expanding.
CarMax builds competitive advantage by gathering data about inventory, customers & operations that individual dealerships can’t match.
CarMax accumulated operational expertise in a complex business that eventually created barriers to entry so deep that the company now has virtually no competition.
CarMax’s first contact with customers is online, in an industry where the in-person salesman had been king.
CarMax’s online competitors are lead-referral sites, which send customers to dealers of varying quality, operating in a broken system.
CarMax has always focused on the long-term, limiting its initial appeal to investors, but maximizing return on invested capital over time.
CarMax built a culture of respect for its employees, despite competing in a dog-eat-dog industry. For the sixth consecutive year, Fortune just chose CarMax as a Top 100 company to work for. No auto dealer or manufacturer has ever made the list.
CarMax lobbied Congress to override anti-competitive state laws, and failed.
The only argument I’ve gotten in with Austin so far is whether the largest class of American state legislators consists of car dealers or real estate folks. Welcome Austin. We’re glad to have you aboard!
The Demand Index posted its largest year-over-year decline since March 2016
The Redfin Housing Demand Index has remained roughly unchanged for the past four months, inching up 0.3 percent from July to 125.2 in August, as an increase in price drops and softening demand in previously hot markets point to an environment enabling homebuyers to be more choosy. The number of people requesting home tours rose 3.4 percent month over month, while the number of buyers making offers remained roughly flat.
While demand has not changed much in the last four months, it remains well below the levels we observed at the same time a year ago. The Demand Index was down 11.9 percent year over year in August, the sixth consecutive month of year-over-year decreases. The number of homebuyers requesting tours fell 3.5 percent year over year, the third consecutive month of annual declines. The number of homebuyers making offers dropped 20.2 percent year over year in August, the sharpest annual decline since March 2016.
In the interactive chart below, use the dropdown menu in the upper righthand corner to display and download national and metro-level data.
The Redfin Housing Demand Index is based on thousands of Redfin customers requesting home tours and writing offers in 15 major metro areas in the U.S. The Demand Index is adjusted for Redfin’s market share growth and for seasonality. A level of 100 represents the level of homebuyer demand posted in January 2014. You can learn more about the methodology behind the Redfin Housing Demand Index and the data sources we use to measure housing activity prior to purchase. The Demand Index methodology was revised in July to improve the way it accounts for seasonality.
“The housing market is past the heydays of spring and early summer, when most homes received multiple offers from buyers desperate to get a home under contract,” said Taylor Marr, Redfin senior economist. “Several factors are contributing to stalling demand. Tax reform and higher home prices are causing homebuyers to be more careful about their decision-making. Meanwhile buyers on the West Coast are finding that a growing supply of homes can work in their favor, enabling them to be more selective and make less aggressive offers. While overall demand still remains strong, easing inventory pressure is allowing home buyers to be more careful in their purchases.”
Several metro areas posted month-over-month increases in the Demand Index, including San Francisco (4.4%), Chicago (3.1%), and Atlanta (1.7%). But those gains were moderated by declines in Orange County (-10.8%), and others.
New Feature Combines Machine Learning with Homeowner Input for a Smarter Home Value Estimate
Today we announced Redfin Owner Estimate, a tool for homeowners to create an estimate of their home’s value that combines the best of machine learning and human insight.
We created the Redfin Estimate to provide an instant answer to homeowners’ most important question: “What is my home worth?” We’re proud the Redfin Estimate is the most accurate online home-value estimate for on-market homes, but we also recognize the importance of the first-hand knowledge that a homeowner has about her own home when it’s not on the market.
That’s where the Redfin Owner Estimate comes in. The same machine-learning engine that powers the Redfin Estimate can now incorporate homeowner input, resulting in an even more accurate estimate of a home’s value.
This feature addresses one of our top requests from homeowners: to be able to provide their own input and additional information, such as renovations that have been completed, that could impact the estimated market value of their home.
How Does It Work?
An Owner Estimate can be created by the verified homeowner of any off-market or recently sold home. To create an Owner Estimate, the homeowner goes through a step-by-step process to update home facts. Have you added a bathroom or expanded? The Redfin Owner Estimate will incorporate these updates.
The homeowner then selects at least five nearby comparable homes (comps) from a list of 25 recently sold homes in the area. Redfin uses the homeowner’s comp selections to calculate the Owner Estimate.
Once created, the homeowner can keep the estimate private or choose to post it publicly above the Redfin Estimate on their home’s details page on Redfin.com.
The Redfin Owner Estimate puts the power of our proven machine-learning algorithm into the hands of consumers, so they can have a more accurate picture of their home’s value whether they are preparing to sell or simply want a better understanding of their equity. Not to mention, it’s fun!
Get Started
To generate your Owner Estimate, search for your home’s address on Redfin.com. Then click Create Owner Estimate in the Redfin Estimate section.
In Seattle, the Share of Homes Selling Above List Fell to 30% this Month from 50% a Year Ago
In the four weeks ending on September 23, 22.9 percent of homes sold for more than their asking price, across the metros Redfin tracks. More than one-in-five sounds like a lot, but it represents a 2.6 percentage point decline compared to the same period last year when 25.5 percent of homes sold above their list price. The share of homes that sold above list hasn’t been this low since 2016 and has been declining since its peak of 29 percent in June.
“With home price growth slowing to 4.7 percent in August, and a record-high share of sellers dropping their prices, the fact that fewer homes are selling above their asking price is another indication that competition is getting less intense than it has been in recent years,” said Redfin senior economist Taylor Marr. “Inventory pressures are easing in the hottest markets, which is welcome news for homebuyers who are increasingly able to submit an offer without competition and get bids accepted without offering above list price.”
What’s Happening Around the Country
The change is most stark in the markets that have been the most competitive. In Seattle, Denver, Portland and the Bay Area, the share of homes that sold above list is declining rapidly.
For example, in Seattle, 30.3% of homes sold above list in the four weeks ending on September 23, down from 50.6% during the same period last year. The share of homes selling above list hasn’t been this low in Seattle since 2014.
Contrast Seattle to a metro like Austin, where the 2018 trend line tracks pretty closely with the 2017 trend line. In Austin, competition has been fairly consistent over the past few years.
While many metro areas are following the national curve, it’s worth noting that a few metros are bucking the trend. Competition is high in more affordable, inland metros like Buffalo, New York, Indianapolis and Las Vegas. Inventory has been declining steeply in these metros and as a result, the share of homes selling above list price continues to be higher than it was last year.
But not because more people are listing their homes; the number of homes for sale is building up as fewer homes sell year over year.
San Jose and San Francisco, however, are seeing more new listings hit the market.
After more than six years of tight supply and surging prices, the third quarter of 2018 has been a turning point for the housing market in many major West Coast metro areas, where the number of homes for sale has increased dramatically from a year ago.
San Jose, California experienced the largest year-over-year supply increase across 170 U.S. metros for the four-week period ending September 30. In San Jose, the number of homes for sale was up 86.7 percent compared to a year earlier when just over 1,200 homes were on the market. Five other West Coast metro areas were at the top of the list of the biggest increases in the number of homes on the market: Seattle (53.9%), Oakland (28.9%), Portland (27.5%), San Diego (26.8%), and San Francisco (22.5%). Meanwhile, inventory was virtually flat nationwide.
Just a year earlier, inventory in all of these markets was rapidly declining, with double-digit year-over-year decreases in every market but Portland, where the number of homes for sale fell by just 4.7 percent.
Big gains in the number of homes for sale would seem to be a sign that more people are finally listing their homes, which is what homebuyers have long been hoping for. But that’s not exactly what’s happening in most of these markets. Instead, the biggest reason for the buildup of inventory in these markets is that fewer homes are being sold.
A year ago there were more homes selling each month than there were homes being listed for sale, which caused the number of homes on the market to dip dramatically. This year fewer homes are selling, so sales are no longer outnumbering new listings every month. This is allowing inventory to finally begin to build again in several markets, which is good for home buyers and should lead to a more balanced market.
San Jose and San Francisco are exceptions to the trend. Unlike in other metros, San Jose and San Francisco experienced double-digit increases in the number of people listing their homes for sale in addition to a drop in the number of homes sold.
“We are seeing sellers who recently purchased their home putting it back on the market, sometimes without ever moving in,” observed Tina Mancebo, a Redfin agent who works with sellers in San Jose. Despite the growing number of homes for sale, Mancebo says that sellers “have not changed their expectations and want similar pricing and competitive offer terms that their neighbors achieved earlier in the year. Still, if a home for sale checks all the boxes (condition, location, etc.) it sells quickly.”
Despite these shifts, the housing market today still favors home sellers, but these changes are encouraging for buyers who have been frustrated by the lack of selection and bidding wars. A more balanced market means more choices for buyers and more time to make decisions.
In January, we published our annual Hottest Neighborhoods report, identifying the 10 neighborhoods in the country that we predicted would see fast growth in home values this year, based on Redfin.com user data and insights from local Redfin agents. Nine of the 10 neighborhoods in the January report are in San Jose.
Now we’re checking back to see if these California neighborhoods outperformed in home value growth as predicted. We’re also identifying the hottest three neighborhoods in the largest metro areas to close out the year.
To assess the accuracy of our predictions, we calculated median home sale price growth in each neighborhood between December 2017 and July 2018. If home prices grew, the neighborhood was confirmed “hot.” If home prices declined, the neighborhood was deemed “cool.”
Median sale price growth between December 2017 and July 2018.
Eight of our 10 picks for the Hottest Neighborhoods in 2018 were spot on with price growth above 5 percent between December 2017 and July 2018. Our top pick, Bucknall (San Jose), saw prices grow 6.2 percent during that period, and 89 percent of homes sold above their asking price. Our second pick, Cambrian (San Jose), saw 6.1 percent price growth.
Redfin Silicon Valley agent Kalena Masching is not surprised that these neighborhoods saw strong price growth. Masching believes that both Cambrian and Bucknall will continue to be hot neighborhoods.
“Especially as buyers are priced out of the peninsula areas, many of these neighborhoods offer relative price savings,” said Masching. “Bucknall offers a great community vibe. It’s very walkable and also has a desirable commute. Homes in Cambrian are more affordable relative to Bucknall and the nearby areas with similar amenities. New tech campuses moving into downtown and West San Jose provide Cambrian homeowners an easy commute without being right in the middle of the city.”
West Santa Clara (Santa Clara), Lakewood (Sunnyvale), and Rex Manor (Mountain View) all experienced price growth above 10 percent.
Masching explains, “Lakewood has been hot for years, especially with home prices about a million dollars less than nearby Sunnyvale West. Similarly, Rex Manor is significantly more affordable than the surrounding parts of Mountain View. It’s a great place to get your foot in the door if you’re under a $2 million budget and want to be in Mountain View.”
White Oak and Ortega were the two predicted hottest neighborhoods, where prices actually declined between December and July.
“I’ve noticed in Ortega that single family homes are staying on the market a lot longer. Additionally, almost all of the sales from May and June were townhomes and condos, which has a lowering effect on the prices” said Masching.
What Neighborhoods Are Hot in your Metro Area?
Below we’ve ranked the top three hottest neighborhoods in each major metro area so you can see what places in your city are likely to be the most popular among buyers for the remainder of 2018. These places were identified using our Hottest Neighborhoods algorithm, which ranks neighborhoods based on increases in favorites and visits to home listings on Redfin.com.
Fall is officially here, and that means it’s time to indulge in your favorite seasonal drink: the pumpkin spice latte. Infused with traditional and modern flavors, every coffee shop adds its own twist on the PSL – but we’ve done some sleuthing and uncovered the 10 best cities for pumpkin spice lattes across the entire United States.
Although the pumpkin spice latte is most often enjoyed when the weather gets crisp, quite a few warm cities made the list. Whether you prefer your lattes in sunny Florida or you’re tucked away in the Pacific Northwest, these are the 10 best U.S. cities for pumpkin spice lattes.
Number of coffee shops: 583 PSL Search Volume: 2390 Walk Score: 78
Many of Chicago’s best coffee shops are within walking distance to Lake Shore Drive, where you can sip and take in views of Lake Michigan. With fall foliage nearing its peak, we recommend enjoying your PSL in the Lincoln Park neighborhood. Stroll through Chicago’s largest public park and finish at the free zoo to savor your final sips.
With several locally owned shops also located along the Chicago River, this city has definitely earned its spot at the top of the list.
Number of coffee shops: 450 PSL Search Volume: 1380 Walk Score: 73
We knew Seattle had more coffee shops than most other cities but what we didn’t know was that the vast majority of them have their own delicious versions of PSL. You’ll find great spots along Lake Union, Portage and Elliott Bays, as well as across town on Lake Washington – giving Seattle the most diverse selection of coffee shops we’ve found anywhere.
Number of coffee shops: 869 PSL Search Volume: 390 Walk Score: 96
Most of the best coffee shops are in Midtown of Manhattan, but there are 869 throughout the city – and that means no matter what, you’ll be able to get your pumpkin spice fix when you’re in the big apple.
We recommend ordering your latte to-go and making your way up to Fort Tryon Park for an unbeatable view of the Hudson River.
Number of coffee shops: 294 PSL Search Volume: 1140 Walk Score: 61
Denver may not be the largest city on our list, but it’s definitely able to hold its own when it comes to our favorite seasonal fall drink. Most of Denver’s best coffeehouses are downtown but there are several great spots on the outskirts, too.
Once you have your PSL in hand, explore the pedestrian bridge that crosses over the Platte River. This mile-long path will give you just enough time to finish the last drop.
Number of coffee shops: 628 PSL Search Volume: 260 Walk Score: 81
Beantown is apparently about more than baked beans – it’s about coffee, too. Boston is also known for its colorful fall leaves which makes it one of the top places in the U.S. to grab a pumpkin spice latte.
Most of the best spots are downtown, but you’ll find plenty of charming cafés that serve fabulous PSLs all over the city.
Number of coffee shops: 404 PSL Search Volume: 760 Walk Score: 65
Portland has a tremendous number of coffee shops in convenient locations all over town – on both sides of the Willamette River – and each puts its own twist on pumpkin spice. You’ll find nearly a dozen coffee shops in Old Town alone, earning Portland the sixth spot on our list of great places for PSL.
Number of coffee shops: 285 PSL Search Volume: 270 Walk Score: 96
The Central Business District, Phoenix Hill and the areas surrounding Baxter Avenue are some of the most popular hotspots for pumpkin spice lattes. Many are close to the Ohio River, where you can sit and enjoy the breezes and admire the changing leaves.
Number of coffee shops: 236 PSL Search Volume: 410 Walk Score: 86
Home to the Golden Gate Bridge, San Francisco (and more than a dozen coffee shops within view of the bridge and the bay) has great coffee shops in nearly every district, from Mission District to Civic Center and Mid-Market.
On Sundays, you can find most locals enjoying a fall beverage at the iconic Dolores Park. The convenient location and sweeping views of the city make Dolores Park one of the best spots to wind down with your pumpkin latte.
Number of coffee shops: 175 PSL Search Volume: 620 Walk Score: 69
Minneapolis’s coffee shops are spread out over a large geographic area, which means you have the opportunity to grab a cup of pumpkin spice no matter where you are around town.
If you find yourself downtown, grab your coffee and visit Gold Medal Park for distinctive architecture and sprawling green hills.
Number of coffee shops: 138 PSL Search Volume: 470 Walk Score: 46
Dallas has several highly rated coffee shops in its amazing downtown area, Bryan Place, Cityplace and Uptown Districts. There are dozens of great spots within walking distance of the Trinity River and local parks, too.
There are literally thousands of cities across the U.S. that have fabulous coffee shops whipping up delectable pumpkin spice lattes, but we only had room for ten. We chose the best cities based on these weighted ingredients:
• The number of coffee shops in each city
• Online searches and hashtags for each city
• The average Yelp! rating of all the coffee shops within the same city
• The city’s Walk Score (nothing says fall like a crisp walk with a pumpkin spice latte in-hand!)
I’m Daryl Fairweather, and I’m thrilled to join Redfin as chief economist and contribute to Redfin’s mission of making home buying and selling easier. I will be leading the housing market research team to produce and publish analyses that help consumers better understand the housing market.
In 2009, as a researcher for the Federal Reserve Bank of Boston, I interviewed more than 100 homeowners who were facing foreclosure. I asked them an array of questions to uncover the causes of the housing bubble and subsequent crash. I asked them about their financial situation leading up to the housing crash, and whether they experienced a job loss or unforeseen medical expense. I asked homeowners about the terms of their mortgage. I quizzed them on their financial literacy and asked them hypothetical questions, like “would you rather have $100 today or $110 dollars a year from now?” Every homeowner I spoke with wanted to pay their mortgage, wanted to keep their home, and desperately wanted help. In fact, most were still sending in payments even when they were already in default. These homeowners wanted to do the morally right thing. One woman I interviewed pleaded that I speak with her bank about renegotiating the terms of her mortgage, so she could avoid foreclosure, but all I could do was refer her to a hotline.
Listening to homeowners and learning about the individual and economic consequences of their choices made me want to learn more about how people’s choices shape our economy, and what can be done to improve people’s choices and ultimately people’s lives. That experience led me to pursue a Ph.D. at the University of Chicago where I specialized in behavioral economics. I didn’t think I would end up studying economics or human behavior when I first started my undergraduate studies at MIT. I thought I was going to follow in my grandmother’s footsteps and study engineering. My grandmother, Norma Merrick Sklarek, was the first African American woman to be a licensed architect in New York in 1954. She also became the first in California in 1962 and remained the only African American woman architect in California until 1980. She directed the construction of the U.S. Embassy in Tokyo from 1976-1978, and Terminal One of Los Angeles International Airport from 1980-1985. She was my role model and always encouraged me to study math and engineering. But, when I started at MIT, I fell in love with economics and the way it uses math and statistics to model and predict human behavior. After receiving my bachelor’s degree in economics, I still wanted to learn more, so I continued on to graduate school at the University of Chicago.
At the University of Chicago, I was mentored by Richard Thaler, the “Father of Behavioral Economics” and 2017 Nobel Prize winner. I assisted him in teaching MBA students about how to understand the sometimes irrational behavior of customers, employees, and managers. Thaler’s groundbreaking work in the ‘80s and ‘90s proved people behave in predictably irrational ways. Before that work, economists assumed that prices were determined by rational people who perfectly understood the consequences of their choices. Behavioral economics takes a more realistic view of how people actually make choices and incorporates psychology into our understanding of the economy.
The housing market is a perfect example of how psychology affects the economy. For most people, buying a home is the biggest financial decision they will make in their lifetime, and yet traditionally, homebuyers have no experience and limited information or education on the process or the market. Emotions play a large role in real estate. Sellers often have an emotional attachment to their homes, and feel like their home is special and deserves a better price than what the market dictates. In a heated market, buyers can feel pressured to win, and may overbid on a home for fear of missing out on their dream home. When home buyers and sellers are educated about the housing market and how the home buying and selling process works, they are less likely to fall victim to their emotions.
Redfin was built on the conviction that consumers should have access to as much knowledge as possible about their local housing market, so they can make the best decisions about home buying or selling. Redfin’s unique brokerage model enables its agents to be full-time consumer advocates, there to help buyers and sellers through the process, and provide guidance on when to walk away from a deal and when it’s time to move quickly. Because Redfin agents spend the majority of their time serving customers instead of generating leads, Redfin agents are more knowledgeable about what’s going on in the market. Additionally, Redfin agents earn salaries and bonuses based on customer satisfaction, so they are rewarded for doing what’s best for the customer, and not what will earn the highest commission. This is why I decided to join Redfin, because Redfin is making home-buying and selling easier, more transparent, and more favorable to consumers.
As Redfin’s chief economist, my aim is to help people make even better decisions about buying and selling homes. I’ll study our data on home purchase transactions, and I’ll work closely with Redfin agents across the country to understand the behavior and mindset of homebuyers and sellers. I am excited to dive into Redfin’s unique data to understand how people’s behaviors shape the housing market. For example, if one home in a neighborhood has to drop its price, how does that affect their neighbor’s decision to sell or stay? As another example, through Redfin’s comprehensive surveys, I plan to explore how people’s emotions, like fear during uncertain political times or exuberance after the home team’s Super Bowl win, affect their decision to commit to buying a home? I am also interested in how we can predict changes in the housing market earlier by looking for early signals, like which online listings people view and which views result in home tours and bids. My research using Redfin’s unique data sources will inform my perspective on the current and future state of the housing market, and it will inform Redfin on how to best serve our customers to help them make the best possible home-buying and selling decisions.
To keep up to date on this research follow me on the Redfin blog, Twitter (@FairweatherPhd) and LinkedIn, and follow Redfin on Facebook and Twitter for the very latest data on the housing market with unique insights on the consumer experience.
Seattle, San Jose and Denver—among the nation’s fastest housing markets—are seeing a dramatic slowdown, with as little as one in three homes going under contract within 14 days, down from two in three earlier this year.
As the housing market heated up this spring there were fourteen metro areas around the country (see chart below) where half or more of the homes that were listed for sale between March 5 and April 29 went under contract within two weeks. By mid-September, every single market saw its share of homes selling that quickly fall to below 50 percent, with spring’s fastest markets, namely Seattle and San Jose, California, seeing the largest declines, falling by more than 35 percentage points since spring and over 20 percentage points from a year earlier.
“Sellers in these markets are learning that they need to adjust their strategy. They aren’t seeing the same level of interest from buyers that there was a year ago. As a result, sellers are having to wait longer for offers, and more sellers are dropping their list price to attract buyers,” said Redfin chief economist, Daryl Fairweather.
After heating up dramatically this spring, by late summer most of the hottest markets ended up cooler than a year earlier.
There are a few exceptions. Although they have slowed since spring, a few metro areas are still seeing more listings go pending quicker now than they were a year ago. The share of listings under contract in two weeks:
The common factor among the metro areas that are not slowing down: They’re all smaller cities away from the coasts where homes are much more affordable. This points to a lack of affordability as potentially the biggest factor in why the previously red-hot markets have slowed so much this year.
Methodology
The percentages in this analysis represent the share of listings added to the market during the three periods that were changed to “sale pending” status within two weeks of their listing date. For example, a rate of 50 percent would result if 1,000 new listings were added to the market between August 14 and September 10, 2017 and 500 of those listings had changed to “sale pending” status within two weeks of their respective listing dates. Homes that were already on the market during the analysis periods were not included in any part of the calculations.
Redfin Survey Suggests that Buyers Are Under Less Pressure to Make Hasty Bids as Competition Eases
One in five recent homebuyers said they made an offer sight-unseen, according to a Redfin-commissioned survey in May of 1,463 people across 14 major markets who had bought a home in the last year. That’s down from 35 percent in a similar survey conducted in November, when the share of buyers making sight-unseen offers had been growing consistently for at least a year and a half.
When we first noticed in May that the prevalence of sight-unseen offers had returned to its 2016 levels, we were at a loss for a clear explanation. At that time, the market was breaking records for price growth, competition and home-selling speeds. Buyers felt pressured to move incredibly quickly to secure the most desirable homes, which were off the market in a matter of days. Making an offer without seeing the home first in person had become an advantageous strategy for buyers in inventory-strapped markets like Denver or Seattle.
In July, we first reported that the market was beginning to shift toward buyers’ favor, with rising inventory and slowing price growth. Buyers had become more choosy about what homes to move on and were behaving less hasty in making offers. And now, buyers are facing fewer multiple-offer situations, which allows buyers even more time to visit homes in person before making an offer. We now understand that the declining prevalence of sight-unseen offers was likely an early indicator of this changing market. This is a trend we’re going to watch closely, as we plan to survey homebuyers again this fall to see if the prevalence of sight-unseen offers continues to change.
“Now that most homes are staying on the market for longer than a week, there just isn’t as much pressure for buyers to make offers so hastily,” said Jessie Culbert, a Redfin agent in Seattle. “That’s a big change from earlier this year when sellers set offer review deadlines, and they were strict! This meant that whether or not you had time to physically step inside the home, you had to get your offer in on time in order to be considered. Otherwise you would miss out entirely on the opportunity to compete for it.”
It’s also worth pointing out that one in five homebuyers making offers sight unseen is still a lot, and we believe this is a reflection of the fact that technology has made it easier to learn about a home from anywhere with internet access. For example, using Redfin 3D Walkthrough, a buyer can tour a home virtually on their computer or smartphone, seeing the walls, appliances and nooks and crannies from every angle. Additionally, Redfin agents use tools like FaceTime, Skype or YouTube to show homes to customers who aren’t able to join them for an in-person tour. This technology is especially useful to homebuyers moving to a new city, who would have to drive for hours or take a flight to see a home. Over time, as technologies continue to advance and people become more comfortable relying on them to make big financial decisions, we expect sight-unseen offers to become more commonplace, even throughout fluctuations in supply and demand.
Methodology
Redfin contracted SurveyGizmo to field a study between May 1 and 18, 2018 of 4,264 people from the general population who indicated they had bought or sold a home in the past year, tried to buy or sell a home in the past year or plan to do so this year. This report focused on responses from the 4,264 people who indicated they bought a home in the previous 12 months. The survey targeted 14 major metro areas (Austin, Baltimore, Boston, Chicago, Dallas-Fort Worth, Denver, Los Angeles, Phoenix, Portland, Sacramento, San Diego, San Francisco, Seattle and Washington, D.C.). Comparisons were made using results from similarly commissioned surveys conducted by SurveyGizmo in May and November 2017.
For more information about the survey and its findings, contact Redfin Journalist Services at press@redfin.com.
There are two ways to own your home. Either you can pay cash upfront or you can pay little by little, year after year. For most us, monthly mortgage payments are the most feasible option. While we continue to chip away paying off our homes, some of us may wonder how we can speed up the process. Whatever your reason may be to reduce debt faster, there are a few simple strategies you can easily put in place now to help you pay off your mortgage early.
Why Pay Off Your Mortgage Early?
When you pay off your home loan faster, you end up paying less for your home than if you were to pay the minimum required payment for the term of the loan. Paying off your house early will save you thousands, tens of thousands of dollars and possibly more, over time. How? Let’s do the math with the following hypothetical example.
Let’s say you get a $300,000 home loan based on a 30-year term and at a fixed annual percentage rate (APR) of 4.46% (current APR as of 10/1/2018). If you were to pay the minimum, your monthly mortgage payment would be $1,512.93 every month for 30 years. However, by the time you pay your house off, you would not have paid $300,000 for your home but significantly more, in fact, nearly double because of the cost of interest.
Home Loan
APR
Term
Interest Paid
Total Paid
$300,000
4.46% (fixed)
30 years
$244,656.29
$544,656.29*
* For simplicity of calculations, we did not include insurance, PMI, property taxes, or any closing costs associated with buying a house.
In this example, the amount paid in interest is nearly equal to the original home loan. With such a sizeable interest payment, it’s easy to understand why paying off your mortgage sooner is so appealing. But what can you do? Before you start buying lottery tickets or cashing in your coin jar, here are some simple tricks you can use to knock years off your mortgage while saving money in the process.
Set up Bi-weekly Mortgage Payments
This strategy could reduce a 30-year mortgage to 25 years and save you tens of thousands of dollars in the process. Essentially, you will take your monthly mortgage payment (including taxes and insurance), divide that in half, and then make a payment every two weeks rather than once a month. In effect, this strategy will have you make the equivalent of 13 monthly payments per calendar year instead of 12. The result is significant as you can see below.
If we were to use our $300,000 mortgage example from above and apply a biweekly payment of $765.47 (which is half the original mortgage payment) instead of the full monthly payment of $1,512.93, this would be the result.
Home Loan
APR
Term
Interest Paid
Total Paid
$300,000
4.46% (fixed)
25 years
$201,820.63
$501,820.63
Not only do you reduce your mortgage by 5 years but you also end up saving $42,835.37 in the process. Before you implement this strategy, check with your lender to see if they accept bi-weekly payments without charging a fee. If they do charge a fee, this may not be the best tactic to use to reduce your mortgage and you should possibly look to one of our other recommended strategies.
Refinance Your Mortgage
This strategy is highly relative to your situation. If you currently have a high-interest rate but have been in your home for a few years and have built up some equity, refinancing your mortgage may be a good solution before interest rates go up. Even a 1% decrease in your APR can save a considerable sum of money in the long run. Alternatively, if you feel financially capable to handle a larger mortgage payment, a 15-year mortgage over a 30-year could save you tens of thousands of dollars. Again, using our hypothetical example from above with a higher monthly mortgage payment of $2,289, we get these results.
Home Loan
APR
Term
Interest Paid
Total Paid
$300,000
4.46% (fixed)
15 years
$111,993
$411,993
Typically, with a 15-year home loan you’re rewarded with a lower APR than a 30-year term; however, even with keeping the APR the same at 4.46% we can still see a substantial difference in total interest paid. Not only would you pay $132,663 less in interest you would have also effectively eliminated 15 years of paying on a mortgage!
A Little Extra Goes a Long Way
You may think that little amounts don’t count for much in the larger picture of a 30-year home loan; such as the money you spend on your morning cup of coffee. However, what if you could shave off years from your home loan by skipping your coffee and instead put that money toward your mortgage? Even one hundred extra dollars each month could save you thousands of dollars in interest payments.
For example, let’s say you don’t buy your morning cup of coffee and instead applied that five dollars toward your mortgage. In this situation, we estimate a morning cup of coffee is five dollars- once you add your coconut milk, splash of vanilla, and leave a tip, it adds up! At five dollars a day, we are looking at an additional $100 month that could be going toward your mortgage. Back to our original example of a $300,000 home loan, we will add an additional $100 a month against your mortgage.
Home Loan
APR
Term
Interest Paid
Total Paid
$300,000
4.46% (fixed)
26 years, 5 months
$211,016
$511,016
In this scenario, we have not only effectively knocked off a few years of your mortgage payments, but also reduced your interest by $33,640. Don’t worry, we’re not taking away your coffee. The main takeaway is that a little extra cash towards your home loan can go a long way.
Monetary Windfalls
The main strategy for those wanting to pay off their mortgage early is to focus on reducing the overall principal of their home loan as fast as possible. Monetary windfalls are any form of extra money that comes your way and is technically unplanned for. This could include things like gifts, bonuses at work, cash from working overtime, inheritance, or tax refunds among others.
As we saw in the prior example that even paying an extra $100 a month, or $1,200 a year, you can reduce your mortgage payment by years. Just imagine how many years you could reduce your mortgage if you were to start putting a larger portion of your extra money against your home loan.
Speak to Your Lender
Make sure to speak with your mortgage lender about your financial situation and how you want to pay off your mortgage faster. You don’t want to begin a strategy to pay off your mortgage early only to find out that your lender has penalties for early payments. Some lenders may only allow extra payments to be made within a specific timeframe. Make it clear that when you apply an additional payment that it needs to go against the principal of your home loan and not towards any future mortgage payments.
Take Time to Build Your Strategy
Paying off your mortgage early is all about having the right strategy, tailored to you. Take your time to explore your options, get counsel from your lender and pursue the strategy that will pay off your mortgage the fastest.
September Home Sales Slump, Prices Post Smallest Increase Since the Market Bottomed in 2012
U.S. home-sale prices increased just 2.1 percent in September compared to a year ago, to a median of $292,000 across the 171 metros Redfin tracks. This was the smallest increase in home prices we’ve seen since February 2012, when the median home price bottomed out at $168,000. It’s worth noting that last month’s low level of price growth was driven by the fact that the most expensive markets, including Seattle, Los Angeles and San Jose, California posted double-digit year-over-year declines in sales. As a result, inland metros with relatively affordable homes, like Pittsburgh and Grand Rapids, Michigan, contributed a greater share of sales to the nationwide total than they did last year, putting downward pressure on the national median sale price. In fact, 136 out of the 171 metros Redfin tracks experienced price growth greater than the national median of 2.1 percent, and half of the metros Redfin tracks experienced price growth at or above 6 percent.
For the first time in nearly three years, the number of homes for sale increased year over year, albeit slightly, up 0.2 percent from last year. National inventory growth was led by surges in softening Coastal markets like San Jose (82.7%), Seattle (54.5%), San Diego (30.7%), and Boston (9.1%).
Market Summary
September 2018
Month-Over-Month
Year-Over-Year
Median sale price
$291,700
-3.2%
2.1%
Homes sold
217,600
-17.8%
-4.8%
New listings
259,700
-14.6%
3.6%
All Homes for sale
738,400
0.7%
0.2%
Median days on market
40
3
-2
Months of supply
3.4
0.6
0.2
Sold above list
21.7%
-2.2%
-2.1%
Median Off-Market Redfin Estimate
$307,000
4.3%
8.8%
Average Sale-to-list
98.1%
0.1%
-0.2%
The number of homes newly listed in September rose 3.6 percent year over year, but buyers seemed reluctant to make offers and purchase that new inventory, as September sales fell 4.8 percent year over year. Home sales declined in 50 of the 71 largest metro areas that Redfin tracks. In metros where high home prices have already pushed buyers to their financial limits, rising mortgage rates may be dampening demand. As of last week, the average interest rate for a 30-year fixed-rate mortgage had crept up near 5 percent for the first time since 2011. Last year at this time, rates were still below 4 percent. The biggest sales declines were again in West Coast metros, including Seattle (-27.7%), Los Angeles (-21.5%), and San Jose (-20.8%).
Across Redfin metros, the typical home that sold in September went under contract in a median of 40 days, two days faster than last year. Still, competition was noticeably less intense than last year. This September, 21.7 percent of homes sold above the list price, down from 23.8 percent last September. Likewise, the share of homes that went under contract within two weeks fell to 23.1 percent this September compared to 24.1 percent last September.
A Tale of Two Markets: The Coasts and the Heartland
Last year and earlier this year, Seattle, San Jose and Denver were the hottest markets with homes selling in days, not weeks. These metros have now been replaced by Grand Rapids,Omaha, Nebraska, and Indianapolis as the fastest markets in the country. In San Jose, the typical home that sold in September spent 26 median days on the market, 12 days longer than last year. In Seattle, the typical home is taking a full week longer to find a buyer, at 17 median days on market.
Meanwhile, metros in the heartland are kicking into high gear. Homes in Grand Rapids are going under contract in just 13 days, 15 days faster than they were last year. In Indianapolis, which is now tied with Boston as the third fastest market, homes are finding buyers in a median of 16 days, compared to 40 last year. This acceleration is due to increasing demand, as new residents move inland in search of affordability, without an increase in homes available for sale. The number of homes for sale in Indianapolis has been falling by more than 10 percent each year since Spring 2015, and fell 19.7 percent this September compared to last year. In Grand Rapids, homes for sale fell 2.3 percent, which is a moderate decline compared to the 5.6 percent decline in September last year, and the 21.2 percent decline in September 2016.
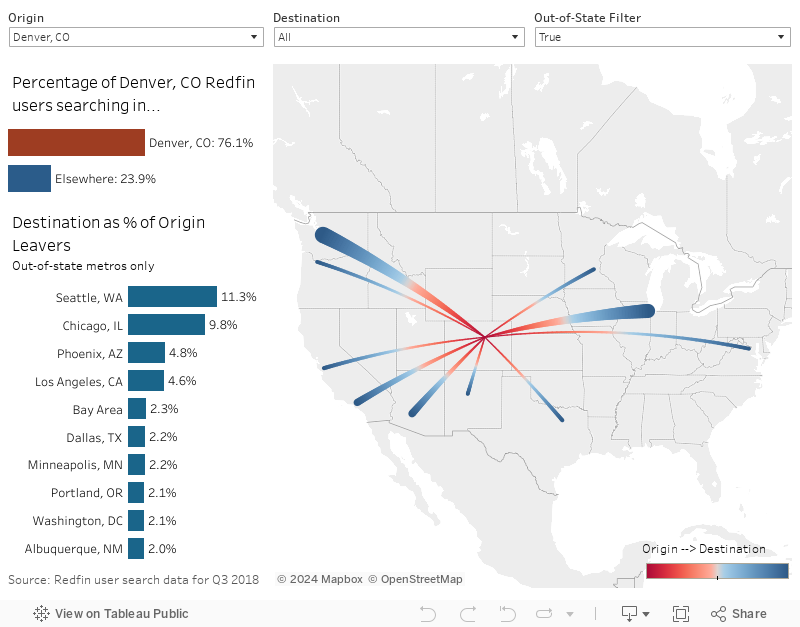
In the third quarter of 2018, 42 percent of the people searching for homes in Grand Rapids on Redfin.com were searching from outside of the metro area, with the largest share coming from Detroit, Chicago and Los Angeles. Indianapolis is also attracting homebuyers from more expensive cities, including Chicago, Los Angeles and the Bay Area.
As homebuyers find themselves priced out of places like Seattle and Los Angeles, they are increasingly looking to cities in the Midwest and South with more affordable homes and lower cost of living. Redfin will soon release its quarterly migration report, which tracks these migration patterns in more detail.
September Highlights
Speed and Competition
Grand Rapids, MI was the fastest market, with the typical home finding a buyer in just 13 days, down from 15 days from a year earlier. Omaha, NE was the next fastest market with 14 median days on market, followed by Indianapolis (16), Boston (16) and San Francisco (17).
The most competitive market in September was San Francisco where 71.8% of homes sold above list price, followed by 58.8% in Oakland, CA, 58.1% in San Jose, CA, 39.6% in Buffalo, NY, and 39.4% in Tacoma, WA.
Prices
San Francisco had the nation’s highest price growth, rising 14.6% since last year to $1,425,000. Las Vegas had the second highest growth at 12.9% year-over-year price growth, followed by Salt Lake City (11.7%), Worcester, MA (11.1%), and Philadelphia (10.4%).
3 out of the 71 largest metros saw price declines in September: Honolulu (-2.2%), St. Louis (-1%), and Houston (-0.4%).
Sales
Seattle saw the largest decline in sales since last year, falling 27.7%. Home sales in Orange County, CA and Buffalo, NY declined by 23.6% and 22.0%, respectively.
In 7 out of 71 metros, sales surged by double digits from last year. The markets with the highest year-over-year sales growth were Miami (39.9%), Jacksonville, FL (28.1%) and Orlando, FL (26.2%). The strong sales growth in Florida this year is a response to last year’s sales slump due to hurricane activity.
Inventory
San Jose, CA had the highest increase in the number of homes for sale, up 87.2% year over year, followed by Seattle (54.4%) and San Diego (30.7%).
Philadelphia had the largest decrease in overall inventory, falling 25.4% since last September. Montgomery County, PA (-22.2%), Indianapolis (-19.7%), and Rochester, NY (-18.2%) also saw far fewer homes available on the market than a year ago.
Redfin Estimate
The median list price-to-Redfin Estimate ratio was 94.0% in San Francisco, CA, the lowest of any market. This indicates the typical home for sale in September was listed at a price 92.7% of its estimated value. Only 7.3% of homes in San Francisco, CA were listed for more than their Redfin Estimate.
Conversely, the median list price-to-Redfin Estimate ratio was 102.3% in Miami, FL and 102.0% in West Palm Beach, FL, which means sellers are listing their homes for more than the estimated value in those metro areas. In Miami, FL, 81.8% of homes were listed above their Redfin Estimate, the highest percentage of any metro.
Below are market-by-market breakdowns for prices, inventory, new listings and sales for markets with populations of 750 thousand or more. For downloadable data on all of the markets Redfin tracks, visit the Redfin Data Center.
EDITOR’S NOTE: The Washington, D.C. and Baltimore metro areas were excluded from this report and analysis due to data accuracy issues. The issues stem from problems with the listings information that Redfin receives from the MLS. Redfin engineers are working with the MLS to resolve the issue, which does not impact the ability to view homes for sale in the Washington and Baltimore metro areas on Redfin.com.
The real estate market has gone through some enormous changes in the past decade, from the tightening of lending standards and the abandonment of most subprime loans to the affordability crisis now plaguing many major cities and metropolitan areas. The houses may have stayed the same, but the way people buy them has changed dramatically.
The currency used to make down payments has started to change as well. Just a few years ago, paying for a home withcryptocurrency would have been unthinkable, but today it is possible. And while not all lenders recognize, or even understand, currency like Bitcoin, a growing number of mortgage companies are taking these alternative forms of payment very seriously. So should you buy your next home with cryptocurrency? Here are some things to consider.
Pros and Cons of Using Cryptocurrency
While buying a house and making a mortgage down payment with cryptocurrency is possible, there are many considerations to weigh when contemplating the use of Bitcoin, Ethereum, or Litecoin to pay for the home of your dreams.
Volatility
For starters, the volatility of the cryptocurrency market should give you pause, even if you currently have the funds to make the transaction happen. How would you feel if the price of Bitcoin plunges a day before the closing, leaving you without the cash you need for the down payment?
Conversely, how would you feel if you sold your Ethereum holdings to pay off your home, only to see the price of the popular cryptocurrency skyrocket? In the end, you could end up regretting the decision, much like the person who used their Bitcoin to buy a couple of pizzas when the coin was worth mere pennies.
Taxes
Next, there are the tax implications of using cryptocurrency. The rules governing the use of cryptocurrencies like Bitcoin, Litecoin and Ethereum are still somewhat vague, and it is easy to make a mistake when reporting profits and losses. If you have been less than scrupulous at reporting your cryptocurrency transactions to the IRS, suddenly using those funds to buy a home or make a down payment could raise the ire of the tax agency, something you definitely do not need.
Diversification
As you can see, using cryptocurrency to buy a home has some potential risks, but there are advantages as well. One of the biggest advantages is diversification – instead of holding the bulk of your assets in volatile cryptocurrencies, you get to branch out into the real estate market which is much more stable.
If you were an early adopter in the Bitcoin, Litecoin or Ethereum revolution, you probably have accumulated a major return on investment. Taking some of that money off the table is a great way to protect yourself and your finances while buying a home and giving yourself a reliable asset.
How to Successfully Sell Bitcoin to Pay for Your Down Payment
The inherent volatility of the cryptocurrency market makes paying for the down payment in those funds impractical. You might feel great if the price of Bitcoin spikes in advance of the closing, but the opposite could happen just as easily.
If you plan to convert your cryptocurrency holdings into real estate, you will first need to sell the Bitcoin, Ethereum, Litecoin or other digital assets. But before you sell, you will need to fully document every part of the process, from the original purchase of the “coin” to the eventual sale. If you fail to keep a valid paper trail, the bank or broker could refuse your mortgage application.
You will also need to make sure your transaction is conducted in U.S. dollars and that any profits are reported to the IRS. The taxing of cryptocurrencies like Bitcoin and Ethereum is complicated and there is still some vagueness to the rules and regulations. If you plan to make any large cryptocurrency transactions, including selling Bitcoin to finance your down payment or qualify for a mortgage, it’s worth consulting a tax expert first. You won’t want to start your home buying experience with a big tax bill from the IRS.
How to Use Your Cryptocurrency Holdings to Qualify for a Mortgage
The real estate market can be a complicated place and the process of qualifying for a mortgage can seem arcane at times. In order for any major change to take place, the buy-in of major players like Fannie Mae is required.
The good news for cryptocurrency holders is that Fannie Mae has recently clarified its position on the use of cryptocurrency in the mortgage qualification process. In its response to a leading mortgage broker, Fannie Mae indicated that Bitcoin could be used to secure a mortgage loan, but only if there was a full paper trail in place.
If you plan to use your cryptocurrency holdings to secure a mortgage loan, you should first make sure you have all the paperwork to back up your claims and your investment. In order to qualify for a Bitcoin-backed mortgage, you will need documentation showing the original purchase, as well as documented proof of the sale.
Similar increases are common in many other markets, leading buyers to ask: “Should I wait and see if prices fall or buy before mortgage rates go up even more?”
If you’re currently searching for a home to buy, or thinking about buying sometime soon, mortgage interest rates are probably on your mind. The rate hikes and home price growth over the past year have resulted in a more than $300 increase in monthly mortgage payments for a potential homebuyer in a market like Portland, Oregon, where the median home price was $445,000 in August. Which leaves those still in the market to buy wondering—should I buy now, or wait and see if home prices fall?
A homebuyer with a housing budget of $2,500 a month and a 20 percent down payment could afford to purchase a home for as much as $473,750 at the beginning of the year when 30-year mortgage rates were averaging around 4 percent. Now that rates have climbed above 4.75 percent, that same buyer can only afford to buy a home for up to $444,000—a loss of $29,750 in purchasing power.
“Every fall and winter we see prices decline relative to spring and summer, but this year’s seasonal declines have been more extreme as buyers, especially in coastal markets, are finally reaching a limit in terms of how much they are willing to pay,” explains Redfin chief economist Daryl Fairweather. “Sellers haven’t quite come to terms with the fact that they no longer have buyers wrapped around their finger. This push and pull is likely to continue until early 2019 when the home-buying season picks back up.”
Let’s say you’re looking for a three-bedroom, two-bathroom home. If your monthly house payment budget is $3,500, an increase in mortgage rates from 5.0 percent to 5.5 percent would reduce the number of homes for sale that you could afford by over 15 percent in Orange County, Honolulu, and San Jose, California. In Boston, Seattle, Los Angeles, and San Diego your selection shrinks by 10 to 14 percent.
Table: Number of Affordable 3-bed, 2-bath Homes For Sale at $3,500 Mortgage Payment
For this table we used the relatively high monthly mortgage payment of $3,500, which is enough to purchase a home around the median price in many coastal markets. The data show that even with a budget this high, your selection of homes for sale can be dramatically affected by rising rates.
Metro Area
Number of Homes affordable at 4% Mortgage Rate
Number of Homes affordable at 5% Mortgage Rate
Number of Homes affordable at 6% Mortgage Rate
Change in # of Homes Affordable from 4% to 5% Mortgage Rate
Change in # of Homes Affordable from 5% to 6% Mortgage Rate
Boston, MA
1,542
1,351
1,129
-12%
-16%
Denver, CO
4,092
3,723
3,310
-9%
-11%
Honolulu, HI
406
290
201
-29%
-31%
Long Island, NY
5,250
4,702
4,074
-10%
-13%
Los Angeles, CA
4,260
3,568
2,810
-16%
-21%
Oakland, CA
801
616
424
-23%
-31%
Orange County, CA
917
605
360
-34%
-40%
Portland, OR
4,736
4,362
3,890
-8%
-11%
Sacramento, CA
3,648
3,377
3,043
-7%
-10%
San Diego, CA
2,249
1,805
1,336
-20%
-26%
San Jose, CA
110
67
44
-39%
-34%
Seattle, WA
2,892
2,396
1,942
-17%
-19%
Washington, DC
8,017
7,461
6,854
-7%
-8%
With a monthly housing budget of $2,500, if rates rise to 5.5 percent, the number of listings on the market that a buyer can afford decreases by 10 to 20 percent in Sacramento, Long Island, Denver, and Portland, Oregon.
If prices actually fall next year (which is not currently expected in most markets), falling prices could offset the cost of rising mortgage rates. However, the bigger your budget, the bigger home price drops you’ll need to see in order to balance out increasing mortgage rates. For example, if your budget is $2,500 a month, you would need to pay $18,000 less for your home to make up for a jump in mortgage rates from 5 percent to 5.5 percent, but if your budget is $3,500 a month, your home price needs to be $25,250 less to keep your payment the same. In most markets that means you’ll be looking at homes that are 100-200 square feet smaller.
Thinking of making a move now before rates go up? Talk to your mortgage advisor or broker to find out how the numbers work for you. If you’re in one of our service areas you can contact Redfin Mortgage for a complimentary one-on-one consultation with a Redfin Mortgage advisor to discuss how much house you can afford. You can also try out different scenarios for yourself in Redfin’s Home Affordability Calculator.
Methodology
The home prices in listed in the chart and examples above are calculated based on the maximum loan a buyer could pay with the given monthly payments, assuming a 20% down payment plus property taxes (1.25% rate) and insurance (annual premium 0.5% of home value). HOA dues were not included in the calculations.
As mortgage rates climb, affordability in the most expensive markets has suffered, driving more people to affordable, low-tax inland job centers in states like Florida, Texas and Tennessee.
In the third quarter of 2018 people continued to move away from high-cost coastal markets like San Francisco, New York, Los Angeles and Washington, D.C., in increasing numbers. Meanwhile, more affordable areas like Sacramento, Atlanta and Phoenix continued to draw thousands of potential new residents. The latest migration analysis is based on a sample of more than 1 million Redfin.com users who searched for homes across 80 metro areas from July through September.
Nationally, 25 percent of Redfin.com home searchers looked to move to another metro area in the third quarter, compared to 22 percent during the same period last year. Affordability continues to be a driving factor causing people to move away from the coasts.
“Rising mortgage rates are exacerbating affordability issues that have been driving people out of expensive coastal metros for the past few years,” said Redfin chief economist Daryl Fairweather. “With rates no longer near historic lows, buyers are increasingly cost-conscious, seeking more affordable homes in low-tax states in the South and middle of the country.”
Moving Out – Metros with the Highest Net Outflow of Redfin Users
San Francisco, New York, Los Angeles, Washington, D.C. and Denver posted the highest net outflows in the third quarter. Net outflow is defined as the number of people looking to leave the metro minus the number of people looking to move to the metro. A net outflow means there are more people looking to leave than people looking to move in, while a net inflow means more people are looking to move in than leave.
Table: Top 10 Metros by Net Outflow of Users and Their Top Destinations
Rank
Metro*
Net Outflow†
Net Outflow Last Year
Portion of Local Users Searching Elsewhere
Portion of Local Users Searching Elsewhere Last Year
Top Destination
Top Out-of-State Destination
1
San Francisco, CA
28,143
16,952
21.9%
17.9%
Sacramento, CA
Seattle, WA
2
New York, NY
23,214
16,647
34.4%
34.4%
Boston, MA
Boston, MA
3
Los Angeles, CA
14,129
15,889
15.8%
15.4%
San Diego, CA
Las Vegas, NV
4
Washington, DC
6,592
5,677
10.4%
10.6%
Philadelphia, PA
Philadelphia, PA
5
Denver, CO
3,290
163
23.9%
17.7%
Seattle, WA
Seattle, WA
6
Chicago, IL
3,050
2,125
9.1%
8.3%
Los Angeles, CA
Los Angeles, CA
7
Spokane, WA
908
N/A
Seattle, WA
Portland, OR
8
Milwaukee, WI
899
152
40.2%
36.1%
Chicago, IL
Chicago, IL
9
Houston, TX
578
328
25.5%
24.4%
Austin, TX
Los Angeles, CA
10
Orlando, FL
492
-345
44.7%
35.0%
Miami, FL
Atlanta, GA
*Combined statistical areas with at least 500 users in Q3 2018
†Among the one million users sampled for this analysis only
Denver: Outflow accelerates
After debuting on the list of top ten metro areas with a net outflow at number seven in the first quarter and moving up to number six in the second quarter, Denver moved up again in the third quarter to pass Chicago at number five. Of all Denverites using Redfin, 24 percent were searching for homes in another metro, up from 17 percent during the same time period a year earlier. Among the Denverites who were searching elsewhere, approximately 23 percent were looking at more affordable metros within the state: Colorado Springs and Fort Collins.
A recent New York Times article points out that Denver has suffered from “years of under-building,” and quoted Colorado State University economist Phyllis Resnick as saying that the region’s affordability imbalance may not correct “just through market forces, unless that’s through people moving out.”
Of all San Francisco Bay Area residents using Redfin, 22 percent were searching for homes in another metro, up from 18 percent during the same time period a year earlier. Of New Yorkers, 34 percent looked to leave, about the same as last year. Of Los Angelenos, 16 percent looked to leave, compared to 15 percent last year.
Moving In – Metros with the Highest Net Inflow of Redfin Users
The places attracting the most people are mostly the same regions that have been growing throughout the past year, including Sacramento, Atlanta, Phoenix and Portland. The metro areas seeing the biggest inflows of new residents are the big cities where home prices are still relatively affordable and job markets are strong. Median prices in the metro areas seeing the largest net inflow average around $150,000 below prices in the metro areas with the largest net outflow.
“We talk with a lot of people moving to Atlanta from areas experiencing more of a slowdown, and they seem to think Atlanta is too good to be true,” said Atlanta Redfin agent Ashley Ward. “Benefits of Atlanta that keep drawing people here include top-notch public education, affordable housing, an appreciating market and more job opportunities.”
Table: Top 10 Metros by Net Inflow of Users and Their Top Origins
Rank
Metro*
Net Inflow†
Net Inflow LY
Portion of Searches from Users Outside the Metro
Top Origin
Top Out-of-State Origin
1
Sacramento, CA
7,029
5,081
42.5%
San Francisco, CA
Las Vegas, NV
2
Atlanta, GA
5,466
2,993
26.5%
New York, NY
New York, NY
3
Phoenix, AZ
5,258
3,200
32.4%
Los Angeles, CA
Los Angeles, CA
4
Portland, OR
3,904
983
18.7%
San Francisco, CA
San Francisco, CA
5
San Diego, CA
3,206
5,979
24.8%
Los Angeles, CA
New York, NY
6
Miami, FL
3,019
1,324
28.0%
Orlando, FL
New York, NY
7
Austin, TX
2,983
1,488
27.5%
San Francisco, CA
San Francisco, CA
8
Tampa, FL
2,811
1,517
51.0%
Miami, FL
Washington, DC
9
Dallas, TX
2,741
1,873
22.5%
Los Angeles, CA
Los Angeles, CA
10
Nashville, TN
2,603
1,653
32.8%
New York, NY
New York, NY
*Combined statistical areas with at least 500 users in Q3 2018
†Negative values indicate a net outflow; among the one million users sampled for this analysis only
Find Your City
Below is an interactive tool to see where people are looking to move and where people are coming from for 80 U.S. metros. Find your city by clicking on the drop down menu:
Methodology
Redfin analyzed a sample of more than 1 million Redfin.com users searching for homes across 75 metro areas from July through September 2018. Users must have viewed at least 10 listings during the quarter. We also excluded locations that in aggregate represented less than 20 percent of a user’s searches. We determined the home metro by mapping the user’s IP address of the most common location they searched from. If a user was searching in more than one metro, we accounted for the share of searches in each metro. Combined Statistical Areas (as defined here) must have had at least 500 users either searching from or in that metro during the quarter.
To calculate net inflow and outflow, we take the number of users looking to leave the metro area and subtract the number of users looking to move to the metro area from another metro area. For example, let’s say there are 3,000 people in Phoenix looking at homes outside of Phoenix. 10,000 people outside of Phoenix are looking at homes in Phoenix. More people are moving to Phoenix than moving away, giving Phoenix has a net inflow of 7,000. (10,000 – 3,000 = 7,000)
It’s worth noting that net inflow and outflow data does not account for Redfin’s market share or the population of metro areas. In metros where Redfin has a larger number of website visitors, we may have a higher volume of inbound and outbound searches than in metros that are smaller or where Redfin has a smaller user base. The U.S. Census Bureau measures net migration flows, which is a common practice when analyzing migratory patterns.
Still, Housing Demand Remains Double Digits Below Last Year’s Levels
Most of Monthly Increase in Homebuyer Activity is Seen in the Touring Stage, with Offer Growth Lagging
The Redfin Housing Demand Index increased 5.1 percent from August to 131 in September, after remaining essentially flat around 124 since May. The month-over-month increase in demand was driven more by growth in early-stage home-buying activity than in the more serious stage of offer-writing. The number of people requesting home tours increased 11.2 percent from August to September, the largest monthly increase in 16 months, while the number writing offers increased by 8.1 percent.
In the interactive chart below, use the dropdown menu in the upper righthand corner to display and download national and metro-level data.
There are a couple of explanations for the increase in buyer activity from August to September. One is that rising mortgage rates motivated some buyers tolook for a home before rates rise again. Second, inventory usually falls from August to September, but this year it rose 0.7 percent, giving buyers more homes to choose from. Inventory increased the most in hot coastal metros including San Francisco (47.7%) and Boston (17.1%). In metros where inventory has increased, buyers are interested in exploring all of their options. However, research by psychologists has shown that when people are faced with more options they have a harder time making a decision for fear of making the wrong, or sub-optimal, decision. This phenomenon is reflected in the fact that touring activity increased more than offer activity as supply increased.
“Buyers hear that the market has slowed and are curious to see what’s available, but in general I find that today’s buyers don’t have the same strong sense of urgency to make offers that they had this time last year,” said Alec Traub, a Redfin agent in Los Angeles, where the Demand Index increased 18.1 percent in September, the largest month-over-month surge posted across the 15 metros tracked. “Buyers tell me they like a home, but they don’t love it. Last year, buyers would jump to offer on a home they only liked, but now they are waiting to fall in love.” Boston, where the Demand Index was up 2 percent in September from August, is a good example of what’s happening nationally. In Boston, growth in homebuyer activity has primarily been driven by an increase in buyers touring, but not necessarily offering on homes. Inventory in Boston grew 17.1 percent in September from August, which is high compared to national inventory gains of 0.7 percent during the same time frame. Likewise, the number of Bostonians requesting tours grew 19.6 percent month over month in September, but the number making offers only increased 3.9 percent.
Though we saw a notable increase in the Demand Index from August to September, it was down significantly from 2017 levels. Last month, the Demand Index was down 10.2 percent since last year, the eighth consecutive month of annual declines. Though both the numbers of buyers requesting home tours and of those writing offers fell year over year, the overall decline in demand was driven by the latter. The number of homebuyers requesting tours fell 1.2 percent, while the number writing offers was down by 13.7 percent. However, when taking a broader view, the Demand Index is now above 2016, 2015, or 2014 levels. This goes to show that buyer demand is still relatively strong, just not as strong as it was in 2017.
If you are seller in this market, know that buyers are still interested and actively looking for homes, but it’s increasingly important that you price your home competitively since unlike earlier this year, only the well-priced, desirable homes are eliciting bidding wars. If you are a buyer, you should view all of the options that are available to you, and make sure you choose a home that you think you will stay in long term. With previously fast markets slowing down, there is no guarantee you will be able to resell your home easily if you find out you don’t like the home you bought.
The Redfin Housing Demand Index is based on thousands of Redfin customers requesting home tours and writing offers in 15 major metro areas in the U.S. The Demand Index is adjusted for Redfin’s market share growth and for seasonality. A level of 100 represents the level of homebuyer demand posted in January 2014. You can learn more about the methodology behind the Redfin Housing Demand Index and the data sources we use to measure housing activity prior to purchase. The Demand Index methodology was revised in July to improve the way it accounts for seasonality.